Why My Ezoic Revenue Dropped in August 2025 Despite Steady Visits: An AI-Aided Analysis
Over the past six months, I reviewed traffic and revenue data from my website integrated with Ezoic, using both CDN and JavaScript (JS) methods. At first glance, the numbers seemed puzzling—traffic stayed steady or even improved, yet revenue dipped in August 2025. By comparing Ezoic’s reporting with Google Search Console (GSC) clicks, the picture became clearer.
This analysis explores how different integration choices, the discontinuation of Leap, and caching conflicts shaped my monetization outcomes. I combined data from Ezoic and GSC, prepared a consolidated table, and analyzed it with the help of ChatGPT. The findings highlight why revenue declined even when visits appeared steady, and what underlying technical factors were at play.
Timeline of Integrations and Key Events
Mar–May 2025 (CDN + Leap enabled): Revenue and ePMV were strong. Bounce rates were average, but monetization was healthy. This period showed the best overall performance.
End of May 2025 (Leap discontinued): The discontinuation of Leap impacted Core Web Vitals (CWV), slowing the site and leading to weaker ad performance. This correlated with reduced GSC impressions/clicks, lower Ezoic visits, and decreased revenue.
June–early July 2025 (Switched to JS integration): To improve CWV, I moved away from CDN and used JS integration. I also optimized my website’s code for performance. Visits from Google remained lower than during the earlier CDN period, but revenue per click stayed moderately better, preventing a complete collapse in earnings.
Mid-July–August 2025 (Back to CDN, without Leap): I switched back to CDN after further optimizing site performance, ensuring CWV issues from post-Leap days were resolved. However, revenue during this second CDN period never reached the levels seen when Leap was enabled. In fact, revenue gradually decreased compared to the JS integration period, despite improved CWV.
Ezoic Support’s Feedback
When I contacted Ezoic support about the decline, they explained that although visits looked steady, bounce rates had increased and visitors were spending shorter periods on the site—factors that can reduce ad revenue. They suggested enabling Ezoic CDN Cache, which they believed would help reduce bounce rate.
However, my website requires dynamic elements for logged-in users, and authorization is handled through cookies, making full CDN caching impractical. I also pointed out that the bounce rate and duration during this period were similar to those of the CDN with Leap back in Mar–May 2025, when revenue was much higher.
What I Looked at Together with ChatGPT
I prepared a detailed table combining Ezoic monetization data and GSC traffic data from the past six months, then analyzed it with ChatGPT. What I found from this AI-aided analysis is as follows:
Ezoic Visits/Pageviews vs GSC Clicks
Ezoic reported lower Visits and Pageviews during JS integration compared to CDN (Mid-July-August). To confirm whether JS integration truly resulted in fewer visits, we compared the figures with GSC clicks, which reflect actual visitors from Google search. It became clear that JS reports lower visits and pageviews for the same number of GSC clicks.
ChatGPT explained that CDN integration tracks every visit, while JS integration only tracks visits when the script executes. This explains why JS numbers are comparatively lower.
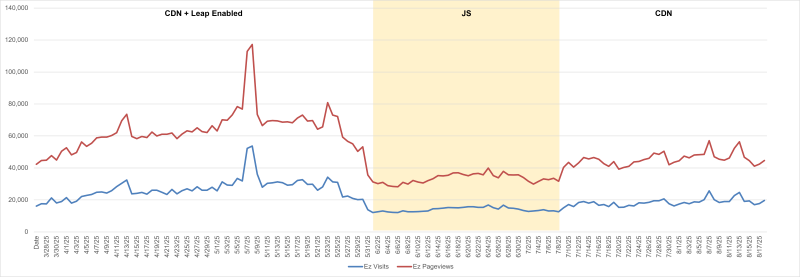
Chart 1: Ezoic Visits and Pageviews during JS and CDN periods.
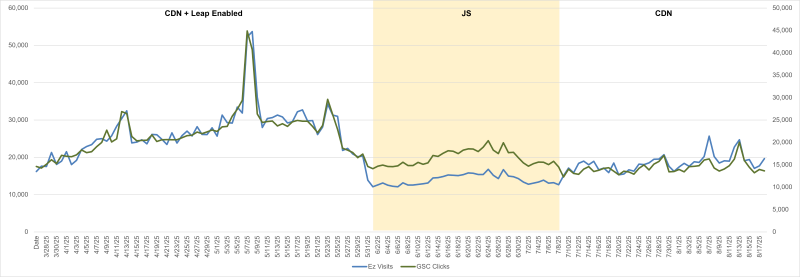
Chart 2: Ezoic Visits correlated with GSC Clicks.
Bounce Rate and Visit Duration
Both CDN integrations (before and after Leap discontinuation) showed similar bounce and duration levels. Yet only the earlier period with Leap enabled produced strong revenue. This indicates that bounce rate and duration are not the true causes of August’s decline, even though they appear worse under CDN.
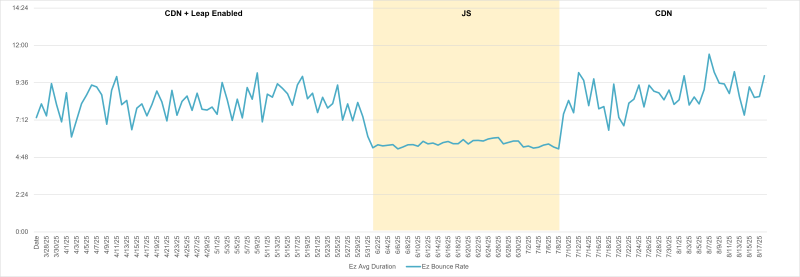
Chart 3: Ezoic Bounce Rate across periods.
Did bounce rate improve during JS integration?
Yes, bounce rate and duration were indeed better under JS integration. While the bounce rate exceeded 30% in CDN, it dropped to around 22% with JS. This is likely because JS undercounts less-engaged traffic, leaving only the more engaged users reflected in the metrics. With CDN, all visits are logged, including quick bounces, which makes the bounce rate look worse and the average duration shorter.
The “improved” engagement with JS is therefore partly a reporting artifact, not necessarily real user behavior. CDN data is more accurate, but it makes engagement metrics appear weaker because it captures everything.
Revenue per GSC Click
Since Ezoic Visits and Pageviews can be artificially inflated or underreported depending on whether I use CDN or JS integration, I decided to compare revenue against GSC clicks instead. GSC clicks provide a consistent measure of Google search traffic, regardless of the Ezoic integration method.
During the JS integration period in June and early July, revenue per click was stronger than during the later CDN period. This indicates that monetization efficiency was higher under JS, even though Ezoic recorded fewer visits. When switching back to CDN, despite having better CWV, revenue per visitor declined.
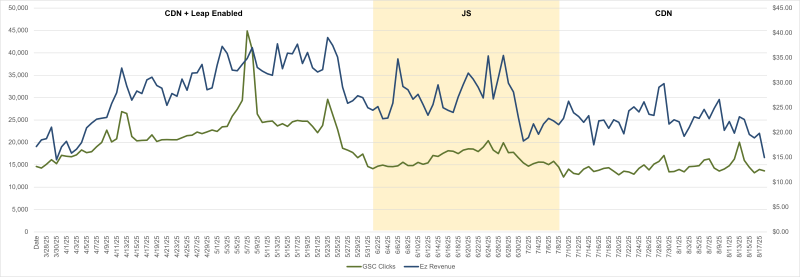
Chart 4: Revenue vs GSC Clicks comparing JS and CDN periods.
Impact of Leap Discontinuation
The discontinuation of Leap in May clearly reduced CWV and contributed to fewer GSC impressions and clicks, which lowered revenue opportunities. Even though I manually fixed CWV later, revenue never returned to Leap-era highs. This highlights how crucial Leap had been for monetization.
Caching Conflicts with CDN
Although CWV was no longer an issue in the recent CDN integration, thanks to my optimizations, caching conflicts became the critical problem. Caching was also strongly emphasized by Ezoic support. With CDN, my site’s original caching headers were overridden, undermining the performance benefits of my own caching strategy. With JS integration, however, caching worked as intended, and monetization efficiency remained more stable.
Conclusion
The analysis shows that the decline in revenue during August 2025 was not caused by bounce rate, visit duration, or CWV, since I had already optimized those independently. Instead, the primary factors were the loss of Leap’s optimizations and the caching conflicts introduced by CDN integration.
While JS integration underreported visits, it preserved my caching setup and produced steadier revenue per visitor. CDN, on the other hand, exposed weaker ePMV trends and gradually declining monetization efficiency, despite improved CWV.
Updates from Ezoic Support (08/21/2025)
My own findings were based on correlations drawn from the data I had. To ensure accuracy, I shared this analysis with Ezoic’s support team. One of the things I value most about Ezoic is how responsive their support is — they reviewed my analysis in detail and provided thoughtful clarifications within hours. Their feedback offered deeper insight into how Ezoic’s system measures bounce rate, adjusts ad density, and handles caching, which helped refine the overall picture.
- Bounce rate reporting: While I initially thought the lower bounce rate shown during JS integration was mostly artificial (since JS might miss less-engaged visits), Ezoic confirmed that their system distinguishes between quick bounces and genuine bounces. This means the lower bounce rate during JS integration may reflect a real behavioral difference, not just reporting artifacts.
- Ad display adjustment: Ezoic’s AI dynamically adjusts the number of ads shown on a page based on bounce rate. When the bounce rate is lower, their system shows more ads, which can increase revenue. When the bounce rate rises, fewer ads are shown to protect user experience.
- ePMV trends: According to their data, ePMV has been relatively stable compared to earlier periods, except during June when JS integration led to higher efficiency. Recent revenue declines are tied more to reduced visits and increased bounce rates (potentially from CDN caching issues) rather than Leap’s discontinuation.
- Next steps: Ezoic suggested either setting up cookie-based cache exclusion rules or continuing with JS integration, which avoids CDN caching conflicts.
My Observations
- I agree that both CDN periods (with and without Leap) show similar ePMV and bounce rates. Therefore, the difference in revenue between these two periods is directly related to the number of visitors. However, visitor numbers dropped dramatically once Leap was discontinued. Although Ezoic’s reports don’t show CWV impact around that time, my Google Search Console (GSC) did report the issue, mainly with LCP.

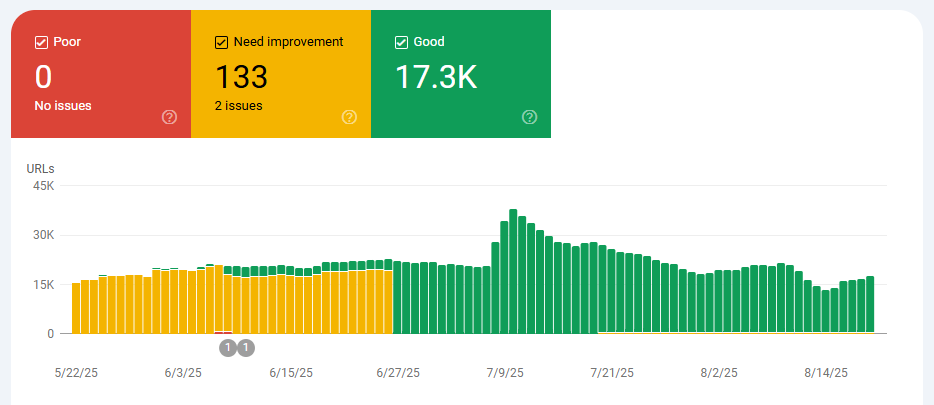
Chart 5: Core Web Vitals Chart from GSC
In that sense, the drop in visitors from Google can be linked to Leap discontinuation, and therefore to the decline in revenue. However, even after I resolved the CWV issues, visitors from Google remain low. This continues to keep revenue below Leap-era levels. - When I compare the recent CDN period with the JS period, visitor numbers are similar (both lower than the Leap era). But revenue was better during JS integration. The bounce rate was reported to be lower in the JS period, which I initially thought was because JS reported fewer visits than CDN. Since Ezoic clarified that their system can distinguish between quick bounces and genuine bounces, it now makes sense that bounce rate could be the reason why the recent CDN period shows lower revenue than JS.
- That said, it still doesn’t fully explain why recent revenue within the CDN period continues to drop despite steady pageviews and similar bounce rates. Could this be related to a broader global decline in ad revenue? Or could there have been some change within Ezoic’s system that affected performance?
Comments
Insight is best when shared. Found it useful or confused by something? Leave a comment — your thoughts might help others and keep the discussion growing!